A new report from Wakely Consulting Group, an HMA Company, models changes to the 2026 ACA market enrollment due to the loss of federal subsidies. Findings suggest a larger drop in ACA marketplace enrollment – lower than some feared, but higher than the CBO analysis.
Written By:
Michelle Anderson, FSA, MAAA
Chia Yi Chin, ASA, MAAA
Michael Cohen, PhD
EXECUTIVE SUMMARY:
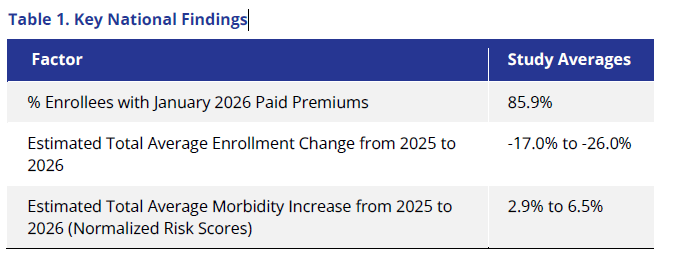
Based on unique data collection from 80% of the Affordable Care Act (ACA) individual market1, Wakely Consulting Group, a Health Management Associates, Inc., Company, estimates a material reduction in enrollment for 2026, ranging on average from 17% to 26% in total. This decrease will likely cause a deterioration in the risk pool in 2026 relative to 2025. We estimate that morbidity could be, on average, between 2.9% and 6.5% worse.
Coupled with significant changes in market composition, these impacts introduce considerable uncertainty for issuers as they develop 2027 premium rates. This report examines premium payment patterns among individual market enrollees—who paid, and who did not—in the early months of 2026 and explores potential implications for the remainder of the plan year and beyond.
The ACA individual market in 2026 experienced a significant upheaval. The expiration of enhanced premium tax credits, changes in premium tax credit eligibility as a result of recent legislation, increased costs because of high trend and inflation, rate correction from potential historical underpricing, and general uncertainty resulted in the largest net premium increase since the initial implementation of the ACA2. The general expectation is that these changes could dramatically shrink the size of the individual market. The Congressional Budget Office (CBO) projected the individual market would decline by approximately 20%, from an average enrollment of 25.4 million in 2025 to an average enrollment of 20.0 million in 20263; however, early indications from Marketplace Open Enrollment Plan (OEP) selection data are that enrollment decreased by only 5% approximately.4
So, what can we make of this discrepancy between CBO projection and OEP data? One possible explanation is that the forecasted enrollment decreases for 2026 were overstated, and the anticipated declines may not materialize. Alternatively, topline plan selection data may present an incomplete story because they include enrollees who did not—or could not—pay their 2026 premiums. If this is the case, actual attrition in the individual market in 2026 could be larger than what was reported through OEP data. The full extent of attrition in the individual market could still be forthcoming.5
Wakely conducted a unique study to evaluate the number of people who paid their first premiums across the entire individual market (both on and off Exchange) in 2026 and other corresponding market shifts. This dataset includes enrollment and premium data from participating issuers in 2025 and January 2026, representing over 30 individual markets (including two merged markets) and an estimated 80% of the total individual market.6 We analyzed January 2026 premium payment rates, shifts in market composition, and changes in member demographics. These insights enabled us to estimate potential ranges of market enrollment reductions and corresponding morbidity impacts in 2026.
Questions? Let’s ConnectKey Findings
We found that, on average, about 86% of members paid their first premium in January. This is a measurement of member premium payment compared to member enrollment, as of the end of January 2026.7 However, there was extensive variation among states. For example, among states we examined, the bottom quartile of states had an average percent of membership with paid premium of 81.9% while the top quartile had an average percent of membership with paid premium of 93.6%. States that had a higher percentage of enrollees who shopped (whether they be returning enrollees or new enrollees), and states with lower premium increases had higher percent paid ratios. In addition, on average, State-Based Exchanges (SBEs) tended to retain a higher percentage of their enrollees compared with the Federally Facilitated Exchanges (FFE) primarily driven by lower increases in member net premium, premium stabilization efforts such as state premium subsidies, Exchange operations, and more efforts on marketing and outreach.
As we consider the rest of 2026, there are factors beyond unpaid premiums that will determine the size of individual market in 2026 compared to 2025. Many enrollees exited the market at the end of December 2025. That reduction in enrollment would not be accounted for in the unpaid premium percentage. Moreover, monthly net attrition will likely look different in 2026 and could result in further enrollment losses over the course of 2026.
Using data on the percentage of paid enrollees and applying assumptions regarding average enrollment duration in 2026, Wakely is now estimating that average enrollment in the individual market could shrink 17% to 26% in 2026 compared to 2025 average enrollment, with significant variation by state, some falling much higher or lower than the potential estimated national range. State-specific characteristics are therefore key for understanding actual enrollment changes, for example, states that implemented their own state subsidy programs may be more sheltered from enrollment loss.
Beyond enrollment losses, we also found that the market composition and type of plans enrollees purchased varied in 2026 compared with 2025 (see Table 2).
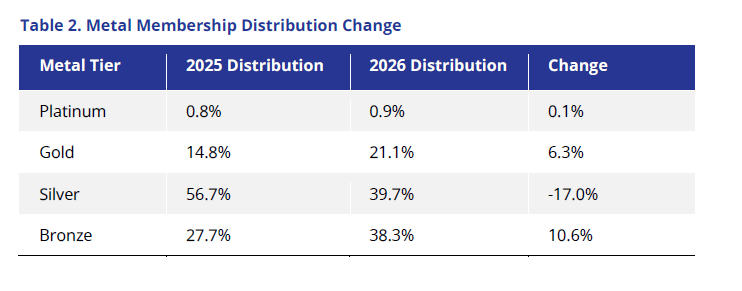
We saw extensive buy downs, with Bronze enrollment as a percentage of total enrollment expanding by almost 11% and Silver enrollment reducing by 17%. Additionally, in states where Gold premiums are lower than Silver, many of the Silver 94% members migrated to Gold plans, increasing that metal membership by 6%. This has implications, not just for consumers who could see large increases in cost-sharing8, but also for issuers who may see differences in premium levels, plan liability, and changes to risk-adjustment transfers.
Finally, given the significant reduction in total enrollment, we anticipate increases to overall morbidity. Given limited data, there are significant uncertainties associated with estimating 2026 morbidity. However given the data we have and prior research9, we estimate morbidity could increase, on average, between 2.9% to 6.5% in 2026. However this national figure may obscure the fact that some markets will exhibit very different changes in morbidity from 2025, potentially outside of the average range noted above.
There is considerable uncertainty about these results. Not only would these estimates vary, potentially significantly by state and issuer, but actual claims cost could vary even more than we estimated. Uncertainties regarding morbidity shifts and member plan enrollment could result in unpredictable and large risk-adjustment transfers, as well as dramatic shifts in claim cost spending patterns.
Changes in plan selection and market composition will cause further uncertainty in estimating 2026 financial accruals and assumption setting in 2027 premium rates. It remains a key question whether the final 2026 average premium rate increases of 26% will be sufficient, as many of the impacts were anticipated, and how issuers will react in 2027 to the estimated significant variation in rate action and potential changes in participation. It will be important to monitor emerging experience, particularly since the 2027 plan filing season is right around the corner. The following sections describe these findings in more detail, including the methodology used in the analysis, additional key findings, their implications, and the limitations of the analysis.
Download Full ReportINTRODUCTION
The Affordable Care Act (ACA) individual market experienced significant change from 2025 to 2026. Several policy changes resulted in large premium increases. The expiration of enhanced premium tax credits (ePTCs), which had been in effect for several years, expired at the end of 2025. Consequently, individuals who had received advanced premium tax credits in 2025 would see their premiums dramatically increase in 2026. For example, Kaiser Family Foundation (KFF) estimated subsidized enrollees would see their monthly premium payments increase by about 114%.10 Unsubsidized enrollees saw the largest premium hike since 2017 at approximately 26%.11
In addition to the expiration of ePTCs, other legal changes reduced Advanced Premium Tax Credit (APTC) eligibility. For example, some people with legal immigration status lost APTC eligibility and saw extensive premium increases.12
Given all of these factors, a key question surrounding 2026 was how many enrollees would retain their ACA individual coverage? If a large enrollment drop occurs, not only would there be coverage implications (i.e., a greater number of uninsured), but also potential morbidity implications (i.e., a greater proportion of sick enrollees would make up the market), which could have implications for 2027 and beyond.
PLAN SELECTIONS VERSUS EFFECTUATION VERSUS PAID PREMIUMS
The answer to how many people remain in the market depends on how and when you measure enrollment. The Centers for Medicare & Medicaid Services (CMS) has previously released data on plan selections for 2026, which showed an approximately 5% decrease in enrollment.13 However, the data CMS has released measure the “total number of people who have submitted an application and selected a plan, net of any cancellations.”14 It does not capture the number of enrollees who paid their first premium. This is an important distinction, as enrollees who do not pay their first premium would be forced to disenroll and lose their coverage. It is also important to note that an enrollee can be effectuated without paying premiums.
Enrollees who paid their premiums in 2025 or are auto-enrolled in the same plan in 2026 could count as effectuated, depending on when the data are measured.15 Effectuated subsidized16 enrollees with unpaid premiums are in a grace period. Subsidized enrollees in a grace period have 90 days to pay their premiums, after which they are retro-terminated to the start of the grace period. Consequently, effectuation enrollment numbers can shift because you can be effectuated but not have paid the owed premium (i.e., January effectuation data measured later in the year will be lower due to retro-terminations because of unpaid premiums owed).
Hence, measuring the number of enrollees who paid their premium provides a far more accurate representation of what 2026 enrollment will ultimately finalize at, which assists in analyzing and estimating the future individual market size. In reality, some of the people who currently have not paid premiums will pay their premiums and some of the people who have made partial premium payments (who we count as being paid) will not make the full payments needed to maintain coverage. Nonetheless, we think the number of enrollees with paid premiums is a reasonable approximation of what final (post retro-terminations) effectuations will resemble.
METHODS AND DATA
The analysis relied on data from the Wakely National Risk Adjustment Reporting (WNRAR) project. The WNRAR project provides Wakely with summary data from participating ACA-compliant individual market plans. Data reporting is voluntary and, thus, exclusive of some issuers in a given state. Though the data are not representative of the entire market, the WNRAR project collected data from more than 75 issuers in over 30 states and represents nearly 80 percent of ACA-compliant enrollment for the individual market.
The data include 2025 enrollment and risk score summaries from January through December 2025, January 2026 enrollment information as of February 1, 2026, February 2026 member signups from January OEP, member premium information, as well as indicators for members who paid any portion of their January 2026 premiums after APTCs were collected. Using this information, we summarized the proportion of members who had paid their premiums as of the end of January 2026. Many analyses when examining effectuation rates17 have compared the number of Exchange effectuated enrollments to the number of Exchange plan selections (i.e., numerator of effectuated enrollments and a denominator of plan selections).
Our paid premium ratio is not directly comparable because our analysis includes both on and off Exchange data and has definition/timing differences. Nonetheless, our paid members (the numerator) may be considered a reasonable approximation for what post-termination effectuated enrollment resembles. Additionally, given the measurement period, our denominator more closely resembles an early snapshot of effectuated enrollment before retro-terminations have occurred for enrollees with APTCs.
We also compared the estimated 2026 average enrollment with the average 2025 enrollment to determine a potential range in reduction in total market size. Given that the data collected for 2026 only include January member paid data, we applied a few adjustments to infer the average 2026 enrollment as follows:
- Assume that some proportion of January members with unpaid premiums will pay their premiums during the grace period and that some members who made only partial payments (and therefore counted as paid premiums) will ultimately lose coverage.
- Assume some proportion of January members with partially paid premiums, who are currently counted as having paid, will lapse due to making insufficient payments before end of the premium period.
- Assume some proportion of February member signups do not effectuate because of unpaid premiums.
- Estimate net attrition for the remainder of the year. Net attrition would include both Special Enrollment Period (SEP) additions and further terminations of enrollees covered in January and February. Historical ACA data were used as a proxy and a range was applied.
To estimate the potential range in relative level of health of the 2026 ACA market, we relied on 2025 data scored using the 2026 US Department of Health and Human Services Hierarchical Condition Categories (HHS-HCC) risk-adjustment model. Risk scores, normalized for standard demographic factors (plan metal level and CMS federal allowable rating factor age curve), were used as a proxy for relative risk of cohorts to measure the changes that occurred in 2026 relative to average relative risk in 2025.18
In addition, the standard HHS-HCC model includes a special adjustment for members who are in specific Cost-Sharing Reduction (CSR) plans. Given that members may change their plan enrollment from 2025 to 2026 due to premium differences or income changes, we have removed all CSR adjustments for risk scores for the purposes of this analysis. Although the normalized relative risk provides a reasonable approximation to morbidity, it is not a one-to-one correlation between relative risk changes and morbidity. We did not adjust for risk changes due to mix in geography.
To estimate the potential change in morbidity in 2026, we classified the 2026 enrollment into two cohorts, namely “Stayers” (i.e., members who retained the individual coverage within the same issuer) and “Joiners” (i.e., members who are new to issuers within our data collection). Note that the Joiners would have included both members who are new to the individual market as well as members who have switched their coverage. The members that left their 2025 issuer are deemed “Leavers” in this analysis. The key caveat is for the Leavers, we are unable to determine between people who switched insurers and therefore classified as Joiners, and people who ultimately dropped ACA individual coverage in 2026. Consequently, we are unable to understand the exact relative risk differences for those two cohorts.
In our analysis, Stayers retained their 2025 normalized risk scores, whereas Joiners were assumed to have varying levels of normalized risk scores based on the normalized risk scores for average market Leavers. We applied a range of assumptions to capture Joiners being 5% to 20% sicker than the Leaver population. Given that we have retained normalized risk scores year over year for the Stayer population, we have not explicitly assumed any increased acuity that would have occurred outside of changes to population mix in 2026. This is an important distinction and potentially a conservative assumption given recent increases in morbidity among Stayer populations, as reported by various sources in the industry.
We classified states into three distinct categories—federally facilitated exchange (FFE) states that had expanded Medicaid, FFE states that did not expand Medicaid, and State-Based Exchanges (SBEs)19—to determine whether the type of Exchange or state Medicaid expansion influenced results. We anticipated that the types of current enrollees and those newly entering the individual market would differ based on whether the Medicaid program included expansion enrollees. Furthermore, we anticipated that the impact would vary between FFE and SBE states because their operational processes and outreach efforts may differ. In addition, the proportion of SBE states with state-funded subsidy programs is significantly higher than in FFE states, which is likely to affect the data.
Additionally, we used Centers for Medicare & Medicaid Services (CMS) open enrollment period (OEP) data20 to analyze other potential correlations between relative risk changes and the varying enrollment cohorts. These data may be useful indicators for future changes that may occur in the Marketplace.
FINDINGS
Paid Premium Enrollment Reductions
As Table 3 indicates, on average, approximately 85.9% of January members had paid their premiums at the time of our data collection. As noted above, this ratio represents members who have paid at least a portion of the premium after APTC divided by January enrollment, at the time of the data collection. Although some of these individuals may ultimately pay their premiums, given the size of premium increases, it is likely that the vast majority of these enrollees that have not yet paid will ultimately drop their coverage in 2026.
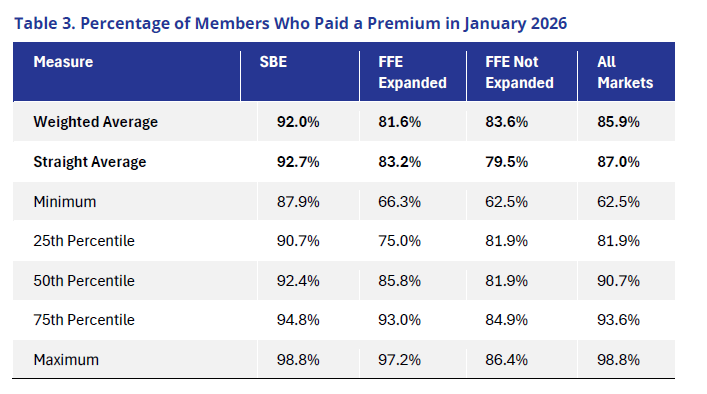
It is important to note the amount and potential reasoning for variation in payment rates. The data Wakely collected showed that the 25th percentile was approximately 82% of paid premiums, and the 75th percentile nearly 94% of members paid their premiums. This variation is even more pronounced depending on the type of Exchange and if the state had expanded Medicaid. Generally, SBE states had a higher proportion of members who paid premiums. Many SBEs had state subsidy programs and extensive outreach programs, which likely improved member retention. There are currently 10 state subsidy programs in the individual market.21 All 10 of these states are also SBEs. Several of these states have substantial state subsidy programs. For example, New Mexico’s state subsidy program fully offsets the reduction in federal subsidies for 2026.22
Conversely, FFE states had a lower percentage of members with paid premiums than SBE states. Within FFE states, most states that expanded Medicaid on a straight average basis, saw more members paying premiums than did FFE states without Medicaid expansion, although the difference between the two was insubstantial, and a number of FFE Medicaid expansion states had high premium payment rates.
Given the variation between states, the reasons for lower percentage of paid premiums are likely extensive. We found two interesting correlations we believe merit discussion and continued monitoring.
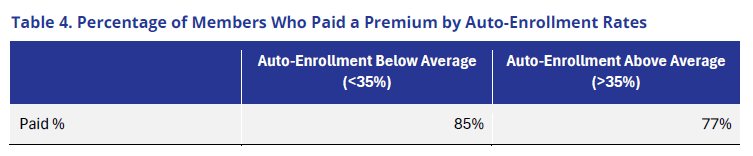
First, states with lower automatic reenrollment rates had higher payment rates, whereas states with an above average share of auto-enrolled members23 in their Exchanges (based on an average rate of 35% from OEP data) had higher payment rates. (see below).
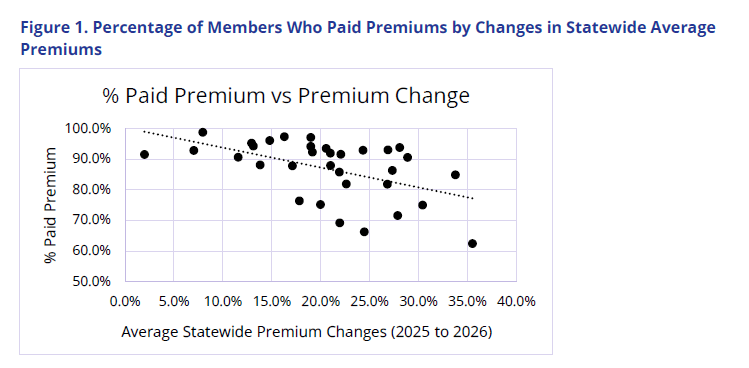
Second, we found a striking correlation between the percentage of members with paid premiums and the change in state average premiums. The higher the premium, the lower the percentage of members who paid their premium. This correlation may be true for multiple reasons. One is that higher premium increases may be driving up premiums for unsubsidized enrollees. It may also be indicative of a different benchmark plan in 2026, which could yield higher net premium increases for subsidized enrollees who did not shop when the ePTCs expired. It may also indicate that issuers correctly priced for large enrollment drops, and therefore states with high premium increases are aligning with large enrollment decreases.
Market Enrollment Reductions
Members with unpaid premiums are only part of the story in attempting to understand changes in enrollment between 2025 and 2026. Other factors to consider include:
- Some members left the market before the start of 2026 and, therefore, were excluded from the percentage of members who paid their premiums.
- States gained members from January Open Enrollment who had February start dates and were not included in paid premium calculations.
- Some members with unpaid premiums may ultimately pay their premiums and maintain coverage; conversely, some members who paid their first premium will exit the market over the course of 2026.
- Some new members will join the market through SEPs over the course of the year.
Consequently, there is considerable uncertainty about final enrollment in 2026, even with the availability of detailed January data. Nonetheless, we have arrived at a wide range of plausible scenarios, as displayed below. In the low scenario, we assumed that net attrition patterns would resemble pre-ePTCs (specifically 2019) over the course of the year. For the high scenario, we assumed that net attrition patterns were worse than 2019, given the high net premium increases and significant reduction in number of people with $0 net premiums. It is possible that with buy downs to Bronze and state subsidy programs, that more enrollees may stay covered in 2026 compared to 2019. Alternatively, it is possible that given the high net premium increases, further enrollment losses will occur, beyond even our increased net attrition. The low does not represent the lowest scenario and the high does not represent the highest scenario, but instead realistic sensitivities of potential 2026 enrollment changes.
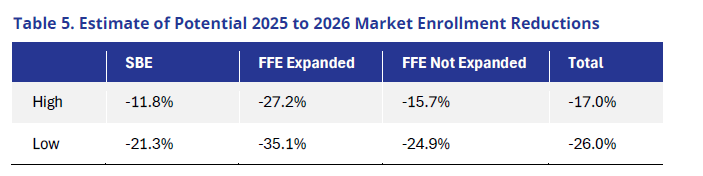
Overall, the individual market does appear to be trending toward a significant contraction in 2026 and may well resemble CBO estimated reductions.24 SBEs on average will likely experience the lowest rates of market enrollment reductions, while FFEs, especially those that expanded Medicaid, could see large declines.
Although this data collection has limits on granularity, data from CMS’s 2026 Open Enrollment public use file appears to indicate enrollees with incomes at 100% to 138% of the federal poverty level (FPL) were less likely to drop their coverage. (This cohort would be heavily subsidized and have the potential to still have a $0 net premium if they bought down to a Bronze plan.) Because FFE states that did not expand Medicaid have a higher proportion of low-income enrollees, they may have fewer enrollment reductions. It is important to note that even within these categories there is significant variation by state. Nonetheless, overall, these numbers indicate that the recent changes to subsidy structures and eligibility are, in fact, having a negative impact on enrollment.
Beyond the topline enrollment changes, there are also significant changes to market composition. The next section examines some of key changes observed in the individual market composition.
Market Composition
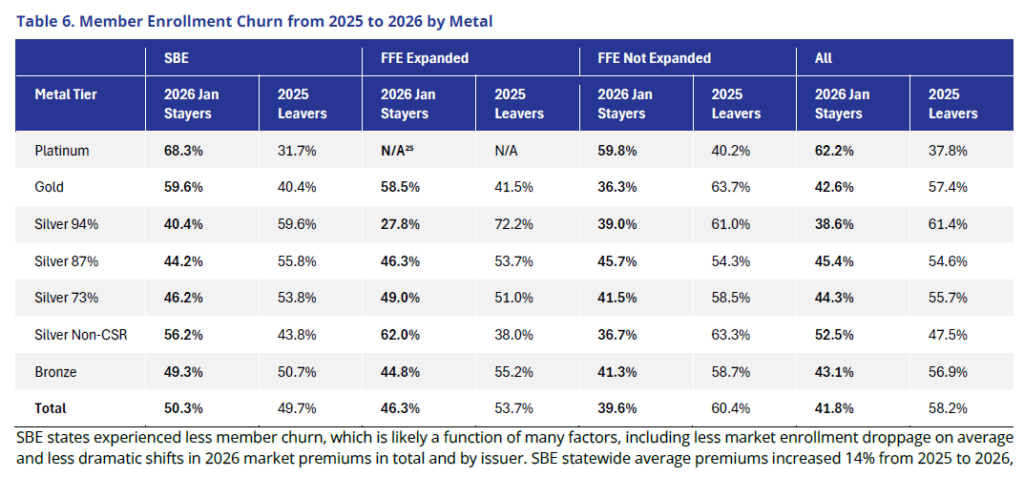
There were notable changes to member demographics and their enrollments between 2025 and 2026. Table 6 below analyzes the proportion of members who stayed with their issuer (Stayers) from 2025 to 2026 and what metal tier was selected compared to members who left their issuer (Leavers) at some point in 2025 i.e., left the ACA market entirely or switched issuers.
Sign up below to be the first to receive information on upcoming webinars on this topic:
Continue the Conversation- For purposes of this paper all references to the individual market should be interpreted as referencing ACA plans or for plans for whom the market reform rules impact pricing and risk adjustment transfers shift money. ↩︎
- Cox C. ACA Insurers Are Raising Premiums by an Estimated 26%, but Most Enrollees Could See Sharper Increases in What They Pay. KFF. October 28, 2025. Available at: https://www.kff.org/quick-take/aca-insurers-are-raising-premiums. ↩︎
- Congressional Budget Office. Federal Subsidies for Health Insurance. February, 2026. Available at: https://www.cbo.gov/system/files/2026-02/51298-2026-02-healthinsurance.pdf. ↩︎
- Centers for Medicare & Medicaid Services. Health Insurance Exchanges 2026 Open Enrollment Report. Available at: https://www.cms.gov/files/document/health-insurance-exchanges-2026-open-enrollment-report.pdf. ↩︎
- Subsidized enrollees with effectuated coverage get a grace period of 90 days to pay their premiums. Consequently, after April there can be substantial revisions to early enrollment numbers. ↩︎
- Data collected includes approximately 238 million member months from 2025 experience ↩︎
- Please refer to the “Plan Selections Versus Effectuation Versus Paid Premiums” section of this paper to better understand the differences in data measurement. ↩︎
- Cohen M, Anderson M, Johnson D. Member Cost-Shifting Implications of Premium Tax Credit Expiration. Association for Community Affiliated Plans. Available at: https://www.communityplans.net/research/member-cost-shifting-implications-of-enhanced-premium-tax-credit-expiration/. ↩︎
- Prior research has tended to show individuals exiting the market due to premium increases tend to be healthier than those who remain. For example: McIntyre AL, Shepard M, Wagner M. Can Automatic Retention Improve Health Insurance Market Outcomes? April 2021. Available at: https://www.aeaweb.org/articles?id=10.1257/pandp.20211083. ↩︎
- Cox C. ACA Insurers Are Raising Premiums by an Estimated 26%, but Most Enrollees Could See Sharper Increases in What They Pay. KFF. October 28, 2025. Available at: https://www.kff.org/quick-take/aca-insurers-are-raising-premiums-by-an-estimated-26-but-most-enrollees-could-see-sharper-increases-in-what-they-pay/. ↩︎
- Ibid ↩︎
- Beginning in 2026, lawfully present immigrants whose income is below 100% federal poverty level (FPL) but are ineligible for Medicaid coverage due to their immigration status lost eligibility for APTCs. ↩︎
- Centers for Medicare & Medicaid Services. Marketplace 2026 Open Enrollment Period Report: National Snapshot. January 28, 2026. Available at: https://www.cms.gov/newsroom/fact-sheets/marketplace-2026-open-enrollment-period-report-national-snapshot-2. ↩︎
- Ibid ↩︎
- Subsidized enrollees who effectuate have 90 days to pay their premiums. During this grace period they count as effectuated. If they never pay their premiums, then their coverage is retroactively terminated. Consequently, January effectuated enrollment could look different if measured in February/March than in April after the grace period expires. ↩︎
- Unsubsidized enrollees also receive a grace period, albeit the length of this grace period is determined by state law. ↩︎
- Lo J, Ortaliza J, Wager E, Cox C. ACA Marketplace Enrollment is Down in 2026—But All of the Data Isn’t in Yet. February 5, 2026. Available at: https://www.kff.org/affordable-care-act/aca-marketplace-enrollment-is-down-in-2026-but-all-of-the-data-isnt-in-yet/. ↩︎
- Normalized Relative Risk = PLRS / (AV * ARF), where PLRS = Plan Liability Risk Score, AV = Actuarial Values, ARF = Allowable Rating Factor. ↩︎
- We only included SBEs in states that have expanded Medicaid in the data presented in this report. ↩︎
- Centers for Medicare & Medicaid Services. 2026 Marketplace Open Enrollment Period Public Use Files. Available at: https://www.cms.gov/data-research/statistics-trends-reports/marketplace-products/2026-marketplace-open-enrollment-period-public-use-files. ↩︎
- Norris L. Which States Offer Their Own Health Insurance Subsidies? March 11, 2026. Available at: https://www.healthinsurance.org/faqs/which-states-offer-their-own-health-insurance-subsidies/. ↩︎
- Grisham ML, Armijo K, Smith AC, Huff KS, Kozlowski N, Flannery D. The Marketplace Affordability Program for Middle Income Households. Health Care Authority. November 18, 2025. Available at: https://api.realfile.rtsclients.com/PublicFiles/6c91aefc960e463485b3474662fd7fd2/50c9a4d0-d5c8-48aa-8b9a-5c43e8fa23bc/Addendum%201_MAP%20P%26P%20Middle%20Income%20Household.pdf. ↩︎
- Centers for Medicare & Medicaid Services. 2026 Marketplace Open Enrollment Period Public Use Files. Available at: https://www.cms.gov/data-research/statistics-trends-reports/marketplace-products/2026-marketplace-open-enrollment-period-public-use-files. ↩︎
- Congressional Budget Office. Federal Subsidies for Health Insurance. February 2026. Available at: https://www.cbo.gov/system/files/2026-02/51298-2026-02-healthinsurance.pdf. ↩︎